Creating a Stimulus with Data Exploration
The Data Exploration Interaction Editor allows you to create interactive graphs.
You will need to use a third-party tool to obtain the JSON text containing the dataset and initial plot state you need.
To complete the Renderer tab for a Data Exploration interaction:
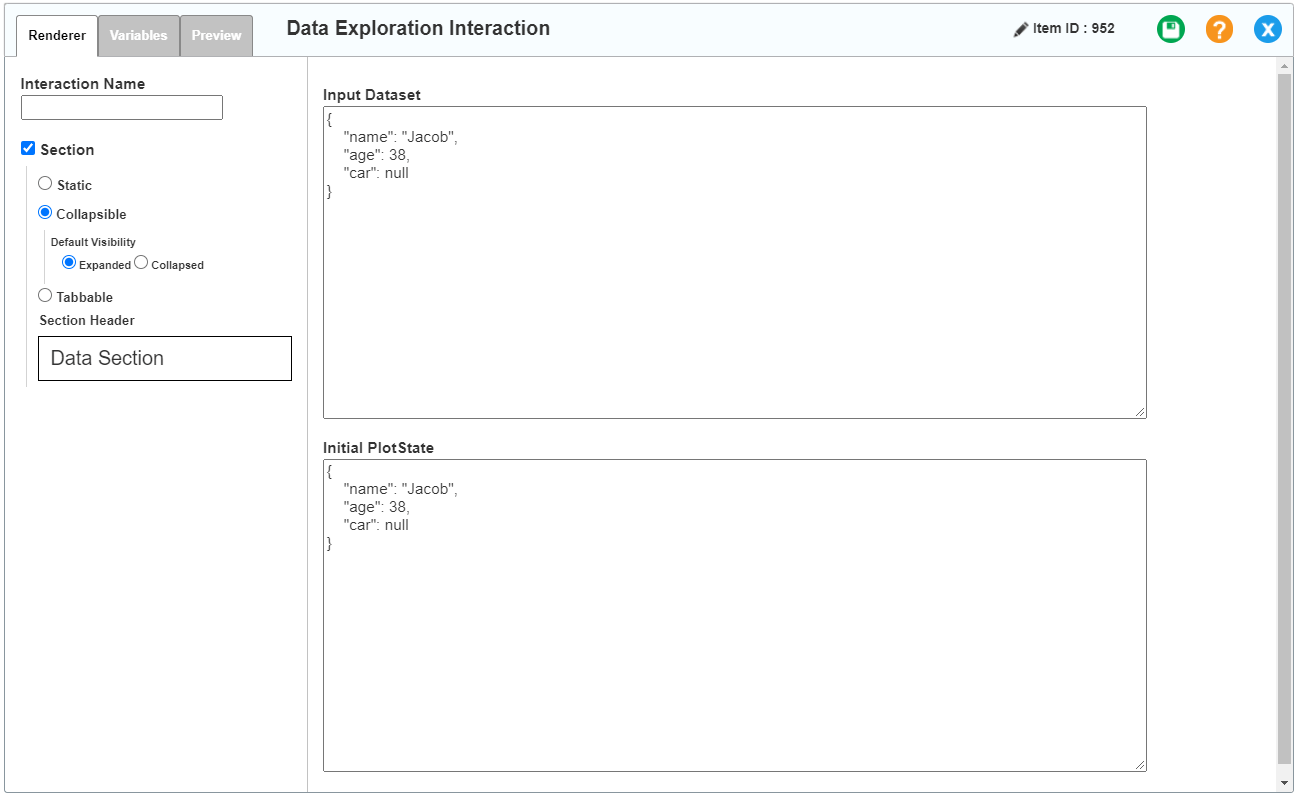
1.In the Input Dataset field, enter the input dataset JSON text as shown in Figure 27.
2.In the Initial Plot State field, enter the initial plot state JSON text as shown in the same figure.
Figure 27: Data Exploration Interaction Editor Window: Renderer Tab
3.To save the entered content, click ![]() in the upper-right corner. Click OK in the confirmation pop-up that appears.
in the upper-right corner. Click OK in the confirmation pop-up that appears.